The Performance Drilldown tab of KPIs & Metrics provides a mechanism for further refining the timescales for some the key metrics included in the 12-month overview.
You may optionally filter the metrics by the member’s “preferred venue”, as well as by date range (or custom dates).
Pre-defined date ranges are provided for: Year-to-date; Quarter-to-date; Month-to-date; Last year; Last 12-months; Each of the last four quarters; Each of the last twelve months; or Custom range.
In most cases, the data is still group by calendar month, but the data within filtered by the range specified. This makes it nice and easy to pull-out quarterly snapshots etc.
Month-on-month and Quarterly comparisons
By design, Quoox does not provide automated month-on-month or quarterly comparisons. This is because, typically, in seasonal fitness industry these are not particularly relevant or meaningful metrics. Clients may download and use the raw data to easily derive such comparisons, if they wish.
Why is this useful?
The performance drilldown page provides a wealth of data that gives you insight into the different areas of your business. Examples of why each is useful, include:
- Members vs Memberships – How has your member and membership count varied over time?
- Revenue (by type, by month) – Typically you should be seeking to cover a minimum of 70% of your base operating expense (BOE) from your recurring monthly receivables (membership payments)1. Take a look a the breakdown of your revenue by type, by month.
- Conversion and Attrition – It is very important to know your lead sources; your conversions; and the flux in your membership base. For the modern training gym this is a little more involved than the old-school models, but these numbers will give you great insight.
- Average sessions per member, per month – Knowing the average number of sessions your members undertake each month is another key metric for facility owners.
- Member communications – How are your members communicating with you, and what is your average response time?
Sources:
1: Thomas Plummer: How to make more money in the fitness industry. Chapter 5.
The base data
Data within many of the overview analytics are broken down by calendar month.
Where the data links to members, data is analysed for unarchived members, who are not currently employees. If a venue is selected, the filter is applied against the member’s “preferred venue”. It should be noted that not all members may have a preferred venue assigned.
Further methodology explanation (where required) is provided against each metric.
The statistics
Members vs Memberships
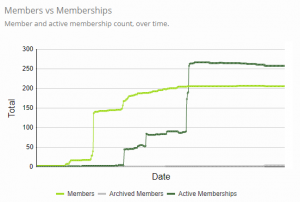
 This line graph shows the total number of members; archived members; and active memberships that you have.
A snapshot count of each figure is taken overnight on a nightly basis.
IMPORTANT: There will be no data prior to you starting using Quoox. Furthermore data prior to 14 Aug 2020 should be considered to be an rough estimate and should not be taken as having great accuracy. Data on or after 14 Aug 2020 may be considered reliable.
- Members is the number of unarchived members at the point of snapshot (active or otherwise).
- Archived members is the number of archived members at the point of snapshot.
- Active memberships is the total number of active memberships at the point of the snapshot.
Revenue (by type, by month)
This table and corresponding stacked column chart provides a summary of revenue (via Quoox) per month, broken down by category.
Important: This data is filtered only by the data range, and not effected by venue selection.
The revenue categorisations are:
- Memberships – Joining fees; pro-rata fees; and recurring fees.
- Credits – Credit pack purchases; and ad hoc credit purchases.
- Sessions – Ad hoc session purchases.
- Store – Any payment made via the store, including tab settlements.
- Refunds – Any refund, regardless of category.
The figures shown are all gross, and inclusive of tax (where applicable).
Conversion and Attrition
It is important for every facility to be aware of their inbound enquiries; leads; trial memberships; and membership flux.
In older, traditional gyms, a member was only considered a member if they had a membership. This is not necessarily the case these days, and certainly not in Quoox.
In Quoox, a member may have one or more memberships. Furthermore, the reasons behind a change in a membership need to be considered (E.g. cancelling a bronze membership and adding a silver membership, as a result of a member “up sell”).
Conversion rates
Quoox deliberately does not calculate conversion rates for you, as these are often misleading an erroneous. By way of an example as to where conversion rates are invalid, let’s look at a simple (but extreme) example:
- In January 2020 you have 1 lead, who comes in on 31st January.
- In February 2020 you have 0 leads, but you convert your lead from January.
- In January 2020, your conversation rate would be 0%.
- In February 2020, your conversation rate would be ∞%, one heck of an improvement! Go team!
The raw (factual) figures are available via the download option, if you wish to apply conversation rate percentages to your data in a manner that you are comfortable makes sense for your business. For example, an average conversation rate over 3+ months perhaps isn’t unreasonable, as the margins for error will likely balance at each end.
Inbound Enquiries
The left-hand inbound enquiries table shows your enquiries across the given date range, broken down by enquiry source. Enquiry sources may be configured within Settings > Lists and Groups. Several common sources have been pre-configured for you, but you may wish to add others (E.g. “Facebook”)
Ad hoc enquiries are those added via the dashboard widget. These are not filtered by venue. The date filter is applied to the enquiry date.
Lead enquiries are determined by the sources applied to a lead. These are auto-set, but may be overridden if incorrect. Lead enquiries, unlike ad hoc enquires, are filtered by venue. The date filter is applied to the lead record creation date.
A total of enquiries by type and overall is provided. A total of converted leads (by lead source) is also provided.
Trial sales
Trial sales comprise a list of trial memberships, with the number of memberships started during the given period. A trial membership is determined by the “is trial membership” checkbox being ticked against the membership in Settings > Memberships.
Membership moves
The membership moves table shows the flux by membership type within the given date range.
A membership is counted as started if it’s start date fell within the given date range. A membership is counted as ended if it was either cancelled or came to a natural end during the given period. In the event of a cancellation, the move is counted when the membership cancellation date is within the period (i.e. if cancelled at the ‘end of period’ and this is outside the date range, it is not counted as yet cancelled).
Important: As outlined above, a membership ending is not necessarily a loss. It may be that the member was upgraded, and thus one membership was cancelled and another started. Similarly, a new membership does not necessarily equate to a new member, as memberships may be layered – with members having more than one membership.
It is strongly recommended that leads be used in preference to ad hoc enquiries, as they are more meaningful and more data can be derived from them. We do, however, appreciate that some customers handled their enquires outside of Quoox and therefore the simpler “ad hoc enquiry” function is provided for this purpose.
Membership flux
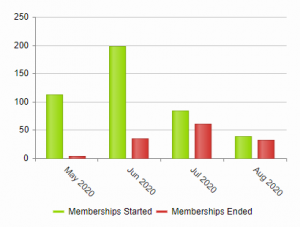
A graph of memberships started and memberships ended per month, over time is provided.
This provides a simple “at a glance” view of membership flux.
In interpreting this data, the above notes are relevant and a membership loss does not always equate to a member loss. Similarly, a membership gain does not always equate to a member gain.
Average sessions per member, per month
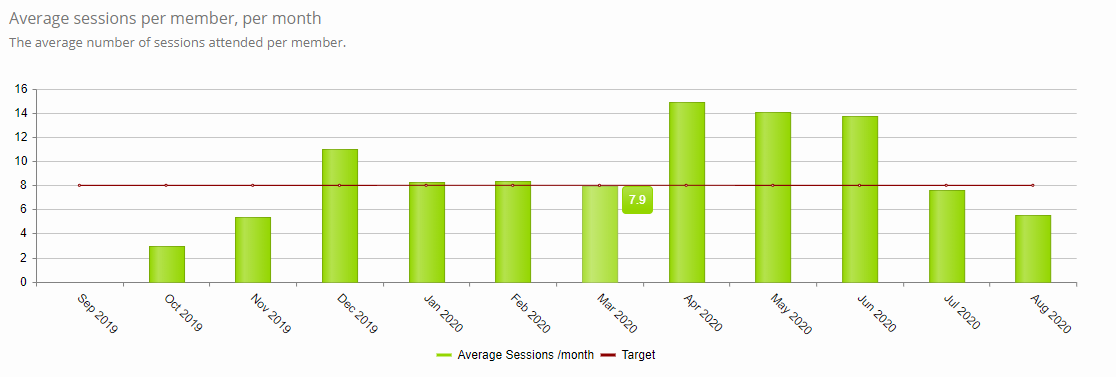
This column chart shows the average number of sessions undertaken by each member, by month. It is overlaid with the target line derived from the “target sessions per month” set in the Settings tab of the KPIs & Metrics area.
Understanding the average session attendance across your members per month is an important metric. Different facilities may have different targets, and hence why this is configurable.
Industry business legend, Thomas Plummer, in his book “How to make more money in the fitness industry” (Chapter 5) states that “The number eight might be the most important number in the fitness industry because the future of every member in your gym is tied to reaching that monthly total of workouts. We call this the Rule of 8.”
Methodology notes
In determining the monthly average, members with no attendance in the given month are excluded from the data set. Average sessions per member is calculated on a per member basis, per month, and then an average taken across those results to get the average session attendance per month. Hint: Hover over the column to view the figure more accurately.
Member Communications
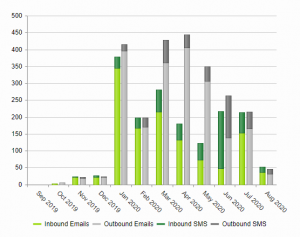
This table and corresponding stacked bar graph reviews your member communications via the message centre, over the given time period, by month. It is not effected by the venue filter.
 The data shows, on a monthly basis, the inbound messages and outbound messages handled by the Quoox message centre, broken down by type (E.g. Email or SMS).
The statistics are for the message centre only, and exclude other communication elements such as: scheduled broadcasts; nurturing communications; XRcize communications; Robonudge reminders; etc.
A message is counted as single message regardless of recipients, so an outbound message with 20 recipients counts as one message.
The average reply time is calculated for inbound messages where a reply was subsequently sent.

